
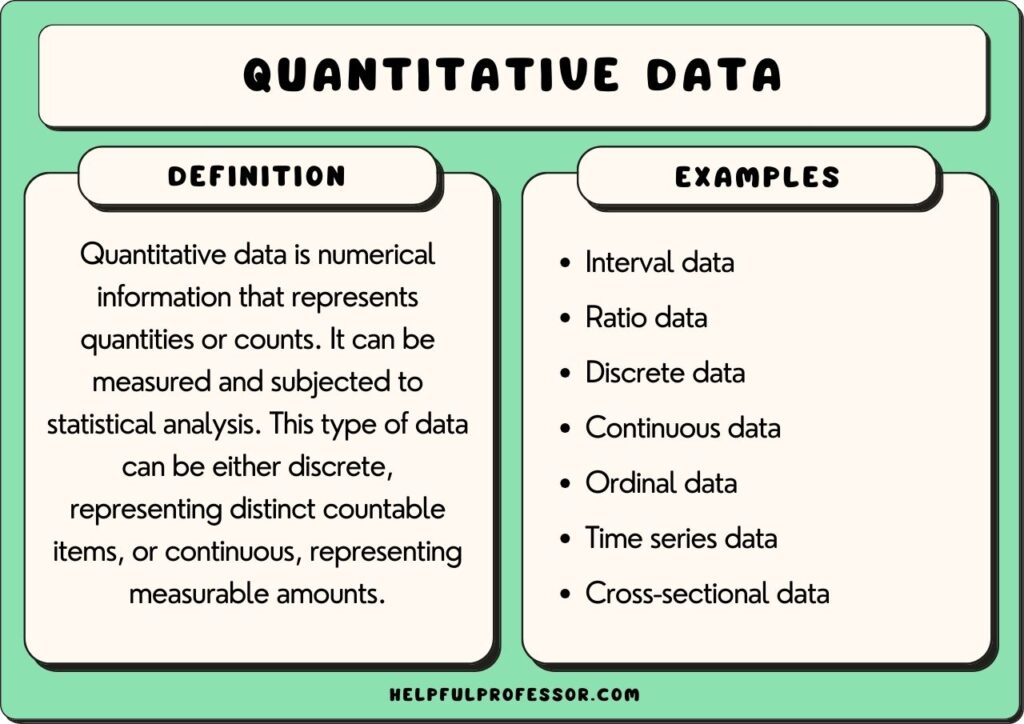
Quantitative data refers to data that is numerical numerical. It can be measured, counted, and statistically analyzed.
The benefit of quantitative data is that it can, when used with sound methodological principles, allow us to make generalizations about entire populations beyond the sample examined.
It is contrasted to qualitative data, which refers to data that is not capable of being measured, but nonetheless holds value in elucidating subjective insights and nuances that don’t emerge from the numbers alone.
The key types of quantitative data are:
- Interval data
- Ratio data
- Discrete data
- Continuous data
- Ordinal data
- Time series data
- Cross-sectional data
Examples of each will be presented below.
Quantitative Data Examples
1. Interval Data
Interval data refers to quantitative data where the distance between each value on the measure is equally split.
This means, for instance, the difference between 1 and 2 is the same as between 2 and 3. With clearly-set intervals, we can compare the quantitative variables, coming to conclusions about how much more or how much less one variable is compared to another.
However, interval data often lacks an absolute or ‘true’ zero, meaning we can’t make meaningful statements about absolute magnitude.
- IQ scores: These are an example of interval data because the difference in points, say between a score of 100 and an 105, is the same as between 105 and 110, providing us a standard difference.
- Temperature in Celsius: As the difference between 10 degrees Celsius and 20 degrees is the same as the difference between 20 and 30 degrees Celsius, we identify this as an interval measurement.
- SAT scores: When we talk about SAT scores, we can say with confidence that the difference between a score of 1500 and 1600 is equal to the difference between 1600 and 1700, revealing the equality in intervals.
- Credit scores: Likewise, in credit scores, a difference of 50 points between a score of 700 and 750 carries the same weight as a 50-point difference between 750 and 800, underscoring the interval nature of the scoring system.
- Seismic Richter scale measurements: Looking at seismic activity, the difference between a 5.0 and 6.0 on the Richter Scale is the same as between 6.0 and 7.0, therefore, we can comfortably class it as interval data.
- Differences in temperatures between days: When we see a 10-degree difference in temperature between Monday and Tuesday, and the same 10-degree difference between Tuesday and Wednesday, this consistent variance in degrees marks this as interval variable.
2. Ratio Data
Ratio data involves a numerical scale with a set order between intervals, and additionally, it provides a meaningful zero point that represents the absence of the attribute being measured (this is what differentiates it from interval variables, above).
One of the strengths of this type of quantitative data is that you can perform all arithmetic operations, including multiplication and division, because the zero point allows for an understanding of absolute values; however, a limitation is that ratio scales are not applicable to all things measured due to the requirement of a true zero point, which cannot exist for some variables.
- Age in years: This is an example of ratio data because zero years accurately represents the absence of age, and the intervals between years are equally distributed, allowing for comparison through division or multiplication.
- Height in centimeters: With height measurements, zero centimeters signifies the absolute lack of height, and the complexity of differential height relationships can be easily described due to the constant interval distribution, making it a perfect demonstration of ratio data.
- Weight in kilograms: Weight measurements are classified as ratio data, as zero kilograms signifies no weight, and the intervals between kilograms are evenly dispersed, enabling exact comparisons and computations.
- Bank account balance: Balances in bank accounts represent ratio data because zero dollars accurately represents the absence of money, and the difference between any figures is consistently proportional, enabling precise calculation and comparison.
- Speed in mph: Speed measurements, like miles per hour, exemplify ratio data because zero mph represents a standstill (no speed), and the intervals between different speeds are evenly distributed, allowing proportional calculations.
- Distance traveled in miles: Finally, measurements of distance traveled are an example of ratio data, as zero miles signifies no distance traveled and the constant interval distribution allows for meaningful calculations and comparisons.
3. Discrete Data
Discrete data describes numerical values that can only be integers, not fractions or decimals, with distinct, separate categories; it’s often used for counting purposes.
A strength of this data type is that it is straightforward and easy to analyze since it only contains whole numbers. However, a limitation is its inability to capture more complex or fractional data, potentially leading to less precise results.
- Number of cars in a household: This is deemed discrete data since the count of cars necessarily involves whole numbers, as one cannot logically have a fraction of a car.
- Number of pets owned: This count of owned pets falls within the discrete data because people cannot own a fractional part of a pet — it’s always a whole number.
- Number of students in a class: Student counts in classrooms are considered discrete data, as the measure involves counting whole individuals, ruling out the possibility of fragments or fractions.
- Number of shoes in a collection: Shoe counts in collections qualify as discrete data, for owning a fractional part of a shoe is an illogical concept, thus yielding only whole numbers.
- Number of books on a shelf: Counting books on a shelf results in discrete data, as these are whole units — you can’t count a fraction of a book.
- Number of languages a person speaks: The number of languages a person can converse in is an example of discrete data because speaking is an all or nothing skill; one cannot quantify it in fractions or partial units.
4. Continuous Data
Continuous data represents measurements rather than counts; these are numbers that can take on any value, including fractions and decimals, within a defined range, allowing us to capture intricate distinctions between things.
An advantage of this type of data is its ability to provide high-precision and detailed results, but a limitation stems from its complexity, often requiring more sophisticated tools and techniques for analysis.
- Time taken to run a marathon: This is an example of continuous data since the completion time can be broken down into infinitesimally precise measurements, from hours to milliseconds.
- Amount of milk in a glass: This quantity of milk represents continuous data because it can be measured with extreme precision to any decimal point, even beyond milliliters.
- Weight of a bag of sand: A sandbag’s weight serves as an instance of continuous data, since the weight could lie anywhere along a continuum and can be measured to a high degree of accuracy, even down to the level of milligrams.
- Height of a tree in meters: The measurement of tree height reveals continuous data, which can be measured across a wide range and to a significant degree of detail, even fractions of a meter or less.
- Volume of water in a reservoir: This is a case of continuous data, as the volume of water held can be measured to minuscule fractions, depicting the exact quantity of water at a given time.
- Amount of rain received during a storm: Rainfall during a storm represents continuous data because it can be measured precisely, down to fractions of a millimeter, hence capturing the full range of likely values within the measurement framework.
5. Ordinal Data
Ordinal data refers to data that can be sorted or ordered, which allows it to communicate relative position or ranking, but unlike interval or ratio data, the distances between ordinal values are not necessarily equal.
This type of data is useful in cases where you need to rank or rate something, providing a clear delineation of a relative hierarchy.
However, a limitation of ordinal data is its lack of precise quantitative details, as you can know the order but are unsure of the magnitude of the difference between categories, thus limiting the statistical methods that can be employed.
- Movie ratings: These are an example of ordinal data, as a rating of 1 to 5 stars establishes an order of preference or quality but does not quantify the exact difference in appeal or enjoyment between each star.
- Socioeconomic classes: By defining groups as low, middle, and high, we establish an order of wealth or income, but these categories do not reveal the exact financial differences between each, making it another example of ordinal data.
- Education level: Education levels ranging from high school to PhD demonstrate ordinal data as they are clearly ordered but do not determine the caliber of knowledge or academic achievement from one level to the next.
- Military ranks: Military ranks also fall under ordinal data, with ranks providing an order of authority, but the precise degree of difference in authority or responsibility between ranks is not quantified.
- Pain scale ratings: This is considered ordinal data because a numerical scale simply orders levels of pain from less to more, without revealing the actual magnitude of the difference between, say, a pain level of 5 and a pain level of 6.
- T-shirt sizes: Sizes such as small, medium, large, and extra-large represent symbolizations of ordinal data, as they designate an order of increasing size but tell us nothing about the precise measurements that distinguish each.
6. Time Series Data
Time series data refers to data points collected or recorded sequentially over time (via longitudinal studies), with time intervals that are equally spaced, allowing for the observation of trends, patterns, or anomalies over the specified time span.
One of the principal strengths of this data type is its ability to reveal trends or patterns that can be critical for forecasting future events or behavior, like in weather patterns or stock market trends.
Nonetheless, a limitation of time series data is that it can be influenced by outlier events or anomalies, and it relies heavily on the assumption that historical patterns will continue into the future, which is not always the case.
- Daily stock prices for a year: This collection represents time series data, with each daily price point plotted sequently over the yearly timeline to monitor trends in the stock’s performance.
- Monthly unemployment rates over a decade: These rates exemplify time series data, as the measurements taken each month over a decade illustrate changes and trends in unemployment over that period.
- Annual GDP figures for a country over 50 years: Such data is a perfect instance of time series data, where every annual GDP measurement over a half-century allows the observation of economic performance and growth trends.
- Hourly temperature readings for a day: These measurements constitute time series data, with each recorded hourly temperature providing a detailed timeline of temperature fluctuations throughout the day.
- Weekly sales figures for a product over a year: This data reflects a time series where each week’s recorded sales throughout the year facilitate the tracking of the product’s sales trends and popularity.
- Quarterly revenue figures for a company over 5 years: These figures are a clear example of time series data, as the financial performance over each quarter of the specified five years provides insights into the company’s growth and profitability trends.
7. Cross-Sectional Data
Cross-sectional data involves collecting and analyzing information from a population, or a representative subset, at one specific point in time.
The strength of this type of data lies in its ability to provide a comprehensive snapshot of a particular group or situation at a specific moment, which is excellent for comparative analysis. However, a significant limitation is that it lacks temporal depth, meaning it cannot account for trends over time or the influence of time-related factors.
- Population of every state in a country at a specific year: This is cross-sectional data, as it provides a snapshot of population figures across all states in a given year.
- Average income of households in different cities at a given time: This reflects cross-sectional data, indicating the income disparities among various cities at a specific time.
- Percentage of smokers in various age groups surveyed in a single year: By gathering this information within a particular year, this example perfectly fits the description of cross-sectional data.
- Literacy rates of different countries captured at the same time: Collecting literacy rates across nations at one point in time represents cross-sectional data.
- Number of hospital beds available in different hospitals on a specific date: This count, recorded on a specific date, forms an instance of cross-sectional data, furnishing us with a comparable, concurrent overview of different hospitals’ readiness.
- Number of patients treated for flu in different hospitals on a particular day: This count is a good example of cross-sectional data, providing a simultaneous snapshot of flu cases in different hospitals on a single day.
See Also: Types of Variables in Research
Q: What is the Difference Between Quantitative and Qualitative Data?
Quantitative data consists of numerical values that can be measured and analyzed statistically, while qualitative data consists of non-numerical values that can be categorized or described. Both types of data can provide valuable insights, but they are analyzed using different methods.Each is explained below:
- Quantitative data relates to numerical information that can be measured or counted, providing output that is typically expressed in numerals such as the age of someone, the number of students in a class, or the temperature of a room. This type of data can be sorted, presented statistically, or used to calculate averages, percentages or other numerical metrics, offering precise, objective, and conclusive findings.
- Qualitative data is non-numerical and encompasses a wide array of information from interviews, observations, or documents to capture individuals’ thoughts, experiences, or interpretations. Its strength lies in providing rich, descriptive, and insightful data that bring out the depth, context, and nuanced understanding of the subject matter.
The main difference between quantitative and qualitative data lies in their nature and level of measurement. Quantitative data zeroes in on ‘how much’ or ‘how many,’ based on numerical quantities, while qualitative data focuses on ‘what’ or ‘why,’ anchored on human perception, experiences and subjective interpretation.
FAQs
What is quantitative data?
A: Quantitative data refers to numerical data that can be measured and analyzed statistically. It is typically obtained through a structured research methodology or from existing data sets.
How is quantitative data collected?
A: Quantitative data is collected through various methods such as surveys, experiments, observations, and analysis of existing data sets. These data collection methods ensure that data is gathered in a systematic and standardized manner. Scientists collect quantitative data, for example, through the use of rigorous quantitative research methods.
How is quantitative data analyzed?
A: Quantitative data analysis involves the use of statistical techniques to interpret and draw conclusions from the data. This can include measures of central tendency, hypothesis testing, regression analysis, and data visualization. Data analytics involves the use of complex tools and software such as SPSS.
What are the advantages of using quantitative data?
A: Using quantitative data allows for precise measurement and analysis, which can lead to more objective and reliable results. It also enables comparisons between different data points and enables statistical inference.
What are the disadvantages of quantitative data?
A: Some disadvantages of quantitative data include the potential for oversimplification, limited insights into the underlying reasons or motivations, and the possibility of missing important contextual information.
Can quantitative and qualitative data be used together?
A: Yes, quantitative and qualitative data can be used together in mixed methods research. This approach allows researchers to capture both numerical data and rich, descriptive information, providing a more comprehensive understanding of the research topic.
What are the different types of quantitative data?
A: There are various types of quantitative data, including continuous data (e.g., height, weight), discrete data (e.g., number of children in a family), ordinal data (e.g., Likert scale ratings), and nominal data (e.g., gender, ethnicity).
How should quantitative data be collected and analyzed?
A: Quantitative data should be collected using a structured research methodology that ensures consistency and reliability. The data should then be analyzed using appropriate statistical techniques to identify patterns, relationships, and trends.

Dr. Chris Drew is the founder of the Helpful Professor. He holds a PhD in education and has published over 20 articles in scholarly journals. He is the former editor of the Journal of Learning Development in Higher Education. [Image Descriptor: Photo of Chris]